
FIFA’s
money match.
Broadcast deals, packed stadiums, global tournaments and billions on the balance sheet—here’s FIFA’s 2023–2026 financial cycle in Canadian dollars.
Three numbers. One very big pitch.
FIFA’s finances move in four-year World Cup cycles. For 2023–2026, the organization projects C$15.6 billion in revenue and C$15.0 billion in spending—with most of the action aimed directly at football.
Projected across the 2023–2026 cycle.
Financial position as at December 2023.
A substantial financial foundation for the global game.
Media rights lead the scoring.
All amounts are in Canadian dollars. Category amounts and percentages are rounded, so totals may vary slightly.
Where C$15.0 billion goes.
Football development · C$8.3B
The biggest share—55%—supports member associations, grassroots programs and the global growth of football.
Tournaments · C$3.0B
Another 20% stages FIFA tournaments and events. Bright lights, big crowds and plenty of match-day logistics!
Administration + marketing · C$3.0B
Administration accounts for C$1.5B, while commercial and marketing activity adds another C$1.5B—10% each.
Solidarity & other · C$0.8B
The final 5% supports solidarity payments and other initiatives. Altogether, more than 73% of spending goes toward football development and tournaments.
FINAL
WHISTLE
More teams. More matches. More fans.
The expanded 48-team FIFA World Cup 2026 in Canada, Mexico and the United States is expected to drive record revenue and global engagement. With 211 member associations and more than five billion fans, FIFA is planning for its biggest tournament yet.
About the figures
- Revenue and expense figures cover the projected 2023–2026 FIFA financial cycle.
- Total assets and equity show the financial position as at December 2023.
- Every monetary amount is presented in Canadian dollars, matching the accompanying infographic.
Figures reproduce the Canadian-dollar data in the supplied FIFA Financial Overview infographic. Values are rounded for readability; projected cycle figures should not be read as audited results for a single year.
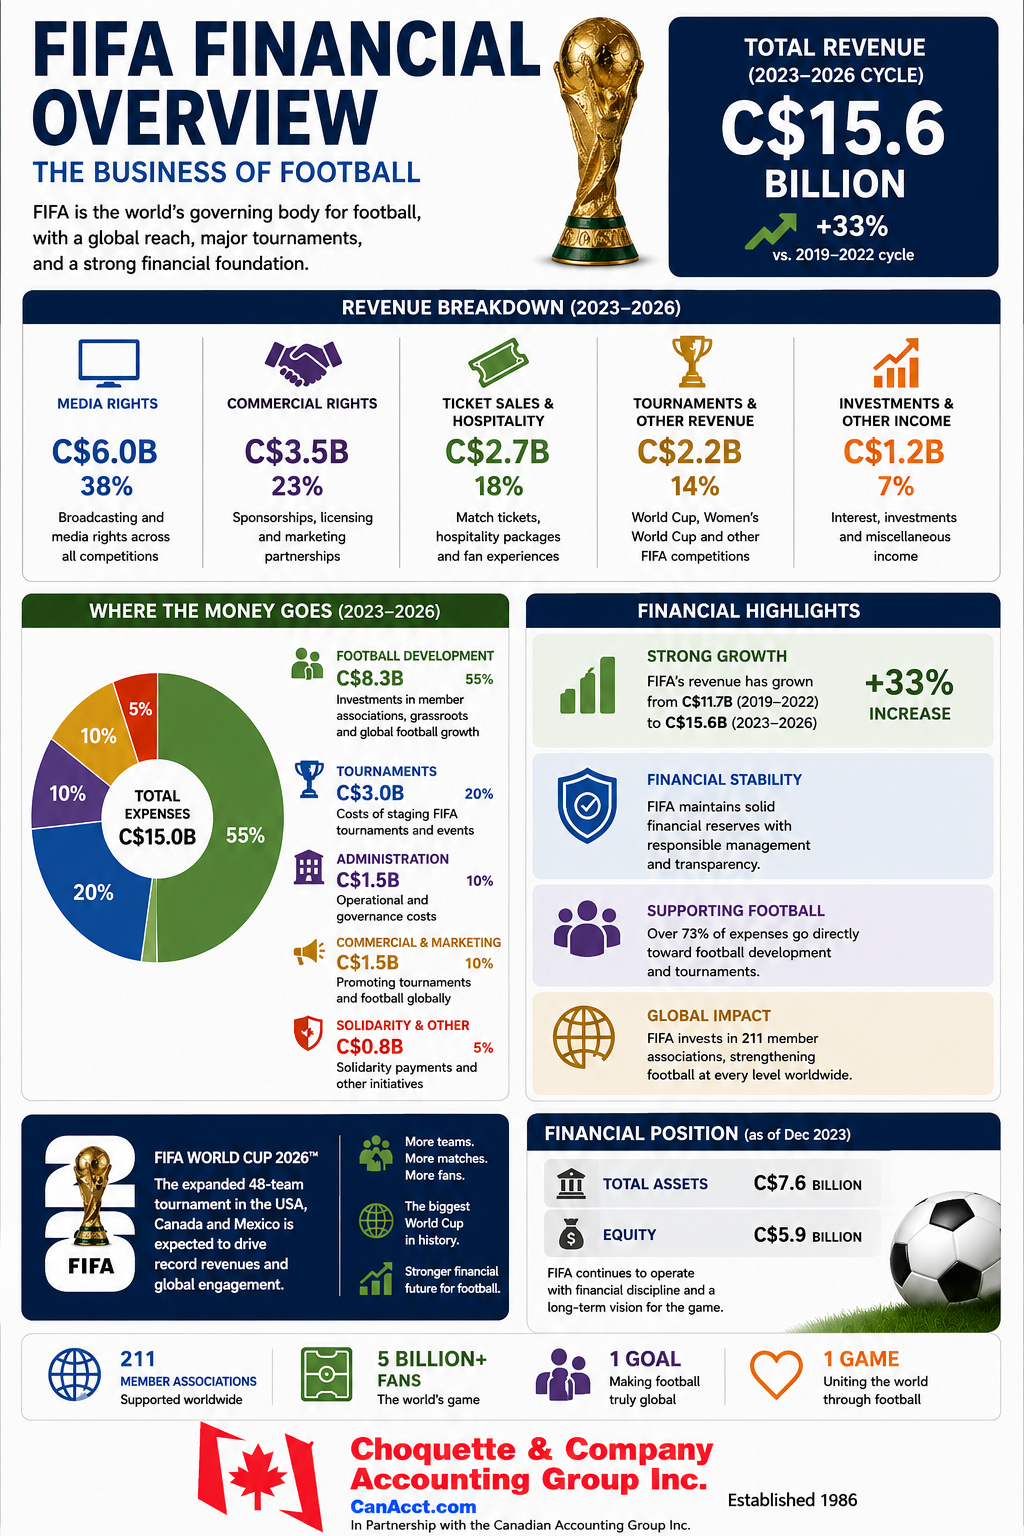 Open the full-size source infographic ↗